2015年3月30日星期一

March-25-2015 Lab 8:Demonstration-Centripetal Acceleration vs. Angular Frequency

Lab 8:Centripetal Acceleration vs. Angular Frequency


Purpose: To determine the relationship between centripetal acceleration and angular speed.

Measurement:
1). How long it takes for disk to make some number of rotation at a range of rotational speed.
2). The accelerometer reading corresponding to each rotational speed.
3). Distance of the accelerometer from the center of the rotation disk.

Set up:
1). Place the accelerometer on the disk. 
Verity that accelerometer reads 0 in the
x and y directions and -9.81 m/s^2 in the
z direction.
2). Spin the disk at some speed. Verify 
that the accelerometer reads 0 in either
the x or the y direction and something 
in the other direction.

For this experiments, we can measure radius by hands.

radius r = 14cm


In this experiment, Turing the disk by plug into power and then using different voltage.


By using the centripetal force formula we got


We got the relationship between a and W by this formula, so what we need to do is to test this relationship is true or not.

How we test it:
If the slope of the function a with W^2 is radius or close to radius r, we say this is the relationship between centripetal acceleration and angular speed.
We using our set up to get many sets of a and the period T, if we know T, we can get the W.


Now we begin our experiments, and then we got our data.


This is just one set of data when power is 4.4V
(I am not gonna show all the originally data, but i will write the acceleration and T on piece of paper.) 


how do we calculate rotation rate of this graph is choosing the point on the graph such that 1 is one rotation, it cost 1.671584s. Then to make this less untertain. chose 9 points 
So rotation rate is f=9/16.461288= rotation/times = 0.5467HZ
for the period T = time / rotations times = 16.461288 / 9 =1.829s


Here is all the acceleration and period combine.


After we got all the data, we can input them into excel, and linear fit the relationship between a and W ^2


Therefore, we got our slope 0.1361. That's very close to out radius we measured by our hands.
So we can say the relationship between is a = w^2 * r
Uncertainty is U = absolte (0.1361-0.14)/0.14*100% =2.78%

Conclusion:

By get the relationship by our function, we test our function by using our experiments. The results is close to the radius we measured but exactly same because of the uncertainty. In this experiment, the uncertainty can be friction of the disk,  the disk not turn one rotation at same rate, and the mistakes made by people. If by trying many times, it's ok to reduce the mistakes; however, the disk is the one made this experiment uncertain such that the equipment is not very accurate. We can see from the data we got compare to one we measured is not very bad, so the uncertainty is not so bad.  

2015年3月26日星期四

March-23-2015 Lab 7: Trajectories

Lab 7: Trajectories

Purpose: To use understanding of projectile motion to predict the impact of a ball on an inclined board.

Material: Aluminum "V-channel", steel ball, board, ring stand, clamp, cartoon paper.

By preidict the result and measure it, should compare with those two results.

To predict the impact of a ball on the inclined.

1).Set up the apparatus as shown.

2).Launch the ball from a readily
same point, and notice that point.

3).Tape a piece of carbon paper to
the floor around where the ball landed.
launch the ball five times from the 
same spot.

4)Determine the height of the bottom of 
the ball when it launches, and how far out
from the table's edge it lands.

In order to test the calculate the result. Measure the height of the ball from the table, 

Phase one:

obtain the predict result of landing distance.

Then we got the speed of the ball when it fly out from the board.

SO height h = 0.94M  distance x = 0.553 m time t = 0.438s
the speed of the ball is v = 1.26 m/s

5) Imagine attaching an inclined board at the edge of the lab table such that the ball launched at the same spot before, will strike the board a distance d along the board. record the angle between the board and the ground.

This picture just show you how this work

get the angle a and d.


Then we predict the distance d with angle 48 + - 1 degree v = 1.26 m/s

d= 0.538m  x = 0.359m  y = 0.399m

Phase two

To get the measured landing distance. 

We also measure the d, x y  by our hands which has uncertainty on it.
first we measure the height from the point to the table and the angle with uncertainty in it. and then we get the distance d.


This is the distance d we measured by our hands. so our prediction is in between the d we measured.
So our prediction is acceptable. that's mean our experiment is good.

Conclusion

For this experiment, we get the results by prediction and measurement, it turns out the those two results are reasonable,


2015年3月25日星期三

March-11-2015 Lab 6:Static Friction and Kinetic Friction

LAB 6 :Static Friction and Kinetic Friction

Purpose: the purpose of this lab is to using the equipment and find out the 

Static Friction and Kinetic Friction by changing the mass and pulling force.

For this lab, we have 5 different experiments.

Beginning

1).We need some different mass of blocks which have enough friction on it.
2). Cup with water, board, laptop, motion detector, and weight measurment.

1.Static fricition

  definition: Static friction describes the friction force acting between two bodies when they are not moving relative to one another.

For this experiment we need set up like this

We are going o add a litter bit of water each time to the cup until the block just start to slip, record the weight of the water.

And then put another block on that red block, and record the weight of water, 

and do it again. record weight of water when has three blocks.

This are the cup weights


and three blocks'mass and we will be using those block for the next five experiments


Here the record when it has red block, water weight 49.9g

when it has red block and normal block, water weight 119.5g

when it has red block, normal block, and blue block, the water weight 127.1g


Because we know that for the max static friction, it's mean that the block just slip, so friction
f = mg and plot the data; we get u = m/ M
u = 0.2985 for the max static friction. This is the static friction between red block and table.

2. Kinetic friction

Kinetic friction as be proportional to the normal force.

f(Kinetic friction) = u_k N  u_k = f(Kinetic friction)/N

For Kinetic friction is fixed not like the static force that will in between zero to max.

So set up the equipment like this.


Pulling the block with the force sensor, then the laptop will have the force vs time graph.


Then those are the force we pulling.
F1 = 0.4475N F2 = 1.24N F3 = 1.379 N

Then we plot the data with force vs N we got
u_ k = 0.2758

3. Static friction from a sloped surface.


Place a block on a horizontal surface. 
Slowly raise one end of the surface
until the block just starts to move


Record the angle.


We got when has red block angle is 15 degree.


We got when has red block and normal block, angle is 12 degree.


We got when has red block , blue block and normal block, angle is 10 degree.


Then after we did the calculation we got u_s = 0.34432

4. Kinetic friction from sliding a block down and incline

With motion detection in the top of an 
steep enough that a block will accelerate
down the incline, measure the angle of the incline and the acceleration.
and then determine the coefficient of kinetic friction between the block and surface 

We measure the angle is 30 degree.


We chose the part when acceleration is constant. we got a = 1.61 m/s^2 .

5. Predicting the acceleration of A two mass system,


The set up will be looking like this kind of picture.


with the motion detector on the other side


First we start with our experiment, and

The hanging mass weight is 50 g.

After we do the experiment on the laptop
we got


a = 0.2983 m ^2

And then we use our result from experiment 4 above.
See what we got the acceleration, and compare to this one.


after we plug all the data acceleration a = 0.362 m/s^2

one is a = 0.2983 another is 0.362, so our experiment is fine.

Conclusion


For this experiment, we have 5 parts in which will test different things and then use all the experiment to check our results.


Mar-16-2015 Lab 5: Modelling the fall of an Object falling with air resistance

Lab 5 

The purpose of this lab to test the free fall with air resistance using the coffee filter.


As we all know, every experiment we need to set up equipment.

Equipment:

1) Enough coffee filters to start the free fall.(Because the filter is big and light, so we air resistance is big enough.)
2) A mac computer with LogPro and excel. 


1.Start the lab.


We have enough coffee filter, set them as 5 groups, in which each has one filter and add one by each group, so we have 1, 2, 3, 4, and 5. Also we calculate the the weight of the coffee filter.(because the coffee filter is very light, so we can calculate such as 50 of them and get one.), so one is 0.926 g.
By using the labPro, it has the capture option so that we can capture the motion and calculate the time, distance, and velocity.

Let one of your classmate standing in almost 3 meter floor. Checking the camera in computer see if you have whole view from the top to bottom, and then we need to do is start collect option in your logPro and told your classmate to let group one free fall and capture the whole falling from the beginning and end and save it and do it with group 2, 3.. until you get 5 perfect video.(In each video you should have like a meter so that we can use it as a measurement in our video.)

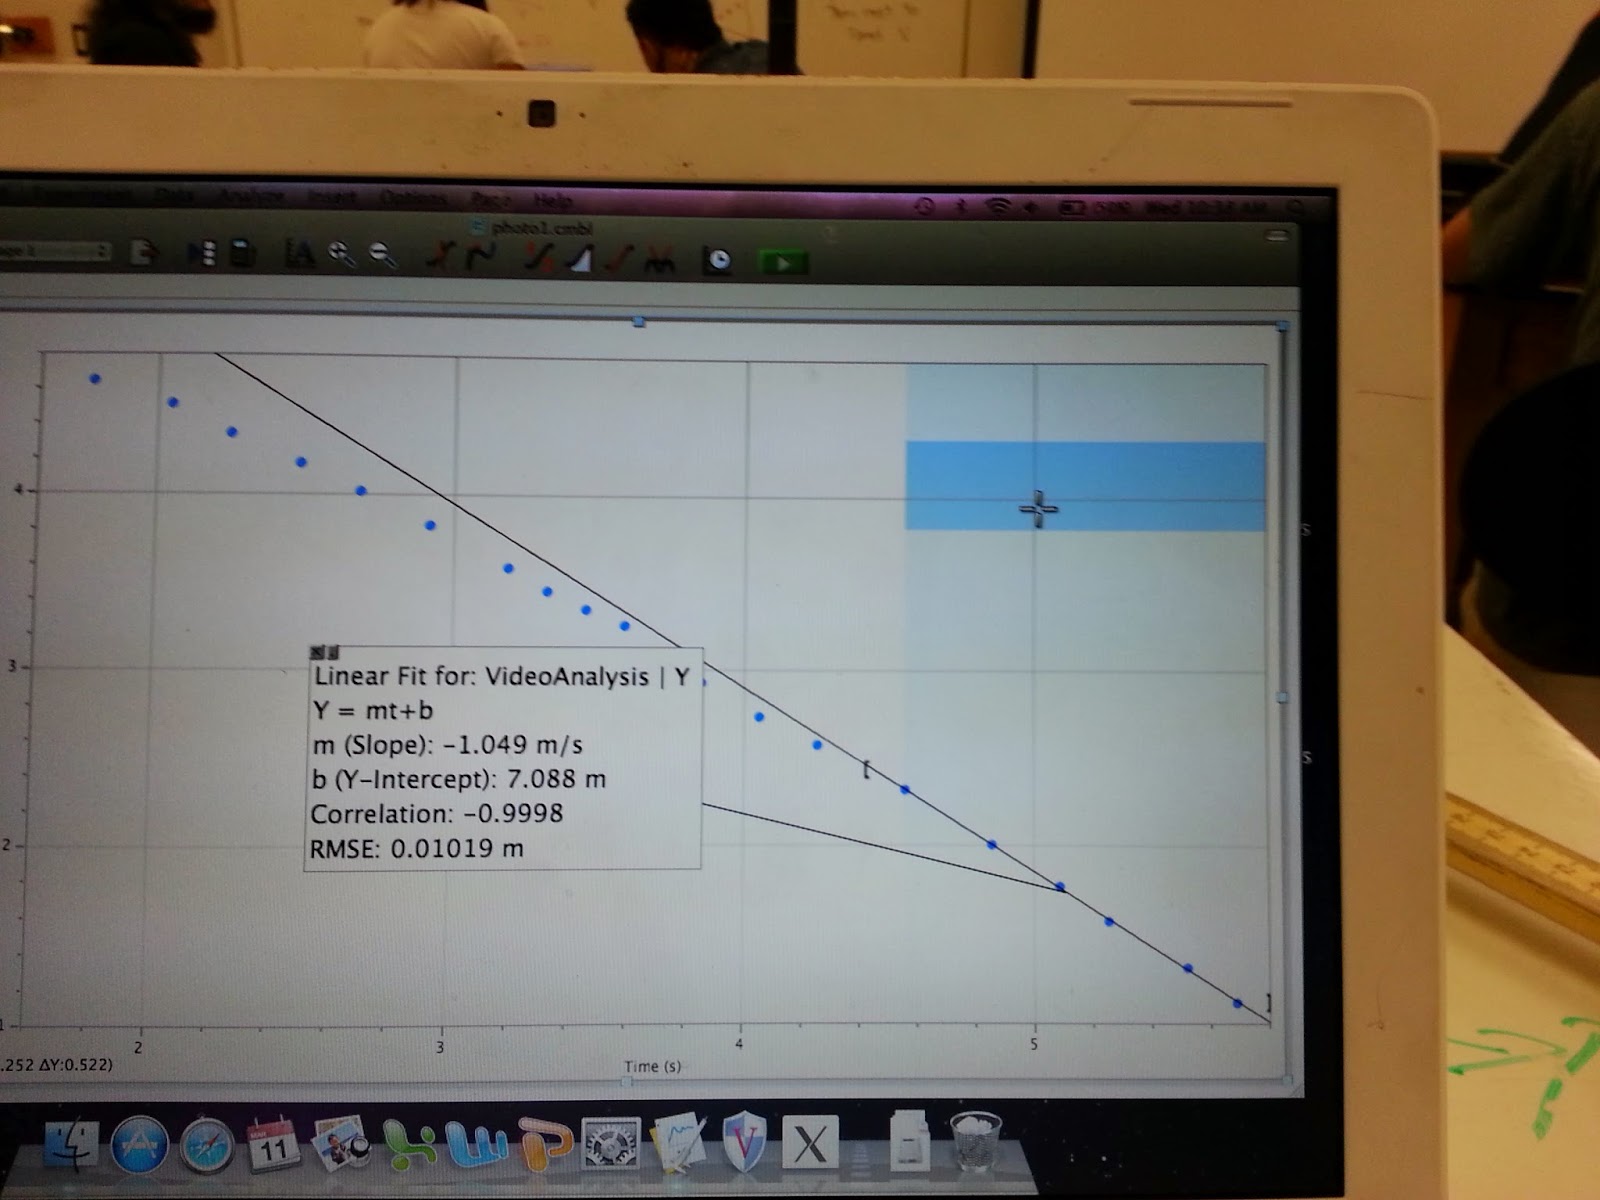
Using the logPro video option and point the coffee filter position from beginning and end. It will give a picture with position vs time graph


We got 5 graph show about position vs time graph. As we can see, I chose last 5 points and linear fit it because we want to know the free fall in which means that the air resistance is equal to mg; the acceleration is 0.(At the beginning of all graphs, that's not good enough.)

Because the acceleration is zero; the velocity should be same. That's mean the slope of the graph is velocity v.

2.Checking 

We know we use mg - F= ma, in a perfect world the acceleration may not be zero, thats' mean mg is not equal to F air resistance.

However, let's assume that mg is equal to F. 


We input the velocity, mass, force(is the mass because they are same.)


Then we made a force vs velocity graph, and power fit it.
We got F = A*V^B  A = 0.01258 +- 0.002242  B=1.497+-0.2451

3. Testing

The goal here is to the mathematical model we developed in part 1 to predict the terminal velocity of our various coffee filters
  We are testing our experiment by saying that mg is not equal to F.
  How we test our results are that we using  F = A*V^B  A = 0.01258 +- 0.002242  B=1.497+-0.2451 to test when the acceleration is not zero and the mg is not equal to F and see if the acceleration is zero what's the velocity is and compare the velocity we got with the computer velocity.

By using excel, we input all the variables and function and set up a small enough interval time △t (because if the time interval is small enough, we can velocity increase and decrease with same rate and also can use the newtons law to calculate the acceleration.)
This the rules that we put in excel.
△t = 0.1 or 0.01s(small enough)

t2= △t+ t1

△v2= a1 * △ t

a1=9.81 m/s^2

a2= a1 - (k/m)*v^n (k=A=0.01258, n=B=1.497)

△x = △t*(v2+v1)/2

x2= x1 + △x

Here are the pictures


To show how to do the experiment, I chose one good sample which m =0.002778kg, v= 1.686m/s, we got from our experiment.(group 3).

We can see the results from picture
After the all steps are good, △t = 0.01. We can see that when t=1.33, acceleration a is almost very close to 0, the velocity v = 1.675942 very close to the results we got in the early experiment. So our experiment is very good.

Conclusion:

  We have done two parts for this lab, one is to get the equation of air resistance F = k* v^n, another part is to using first part test by using mathematical model.

2015年3月20日星期五

09-march-2015 Lab 4: Propagated Uncertainty in Measurements

Lab 4 

Purpose: The purpose of this lab is to find the relationship between density, volume and find out the how they will affect the density by changing and volume. Also, find the relationship between Mass, Angle and Force and find out the how they will affect the density by changing the Angle and Force.

Of course, to begin with this lab, we need to get all the material we need.

First experiment: Measuring the Density of Metal Cylinder. 


1. Find three cylinder with different materiel such as Ferrum, Copper, and Aluminum.

2. Measure their weight, height, radius.


We know the formula p=m/v


If we want to find how density will
change when volume changed, we should 

differential this equation by parts.


When we use AL, we get this.
We can see from our calculation.


So we can see from picture.
uncertainty of Al's density is 0.1169 g/ cm^3 
For this experiment uncertainty is 0.1169, so it's not acceptable depending on the density is 0.56g/cm^3 it's 0.1169/0.56 *100% =20.8%  it's little big for uncertainty.


When we use Cu, we get this.

We can see from our calculation.
Uncertainty of Cu's density is 0.07737 g/ cm^3 
For this experiment uncertainty is 0.07737, so it's acceptable depending on the density is 2.292/cm^3
it's 0.07737/2.292 *100% =3.38%, uncertainty for Cu is good values.

When we use Fe, we get this.


We can see from our calculation.

Uncertainty of Fe's density is 0.06587 g/ cm^3 

For this experiment uncertainty is 0.06587, so it's acceptable depending on the density is 1.71/cm^3
it's 0.06587/1.71 *100% =3.35%, uncertainty for Fe is good values.

Second experiment

To begin for this experiment, we need to set up the equipment and measure the force and angle with two different objects.


Now, we need to read the force and measure the angle for this two objects


As show in picture, we know the force and their uncertainty, and their angle and uncertainty. What we need to do is to calculate the range of the uncertainty and see if the range is acceptable. 


And then we use the function and differential equipment to get the range of the uncertainty by plugging all the data.


This is the function we use to calculate the mass and the change of mass

This is the first mass we calculate. and we plug the data we got the range of this mass should be in between 0.888kg to 1.09kg.

This is the second mass we calculate. and we plug the data we got the range of this mass should be in between 0.702kg to 0.8971kg.

Conclusion:

For every experiment, errors are very common things. Therefore, to avoid making error and to calculate the how big errors are should be the main thing we should do on experiment. This experiment just want to show you how to calculate the errors by using differential equipment by parts.